Turn your trade history into a TradingView-style candlestick review chart
Upload a trade CSV/JSON from Binance, OKX, Bybit, your broker, Tonghuashun, or a backtest. KLinePic converts it to standard trades, then renders a high-quality K-line review chart image with buy/sell markers, return, drawdown, and holding period. Free to start; paid subscriptions add higher limits and watermark-free exports.
Upload trades and generate a chart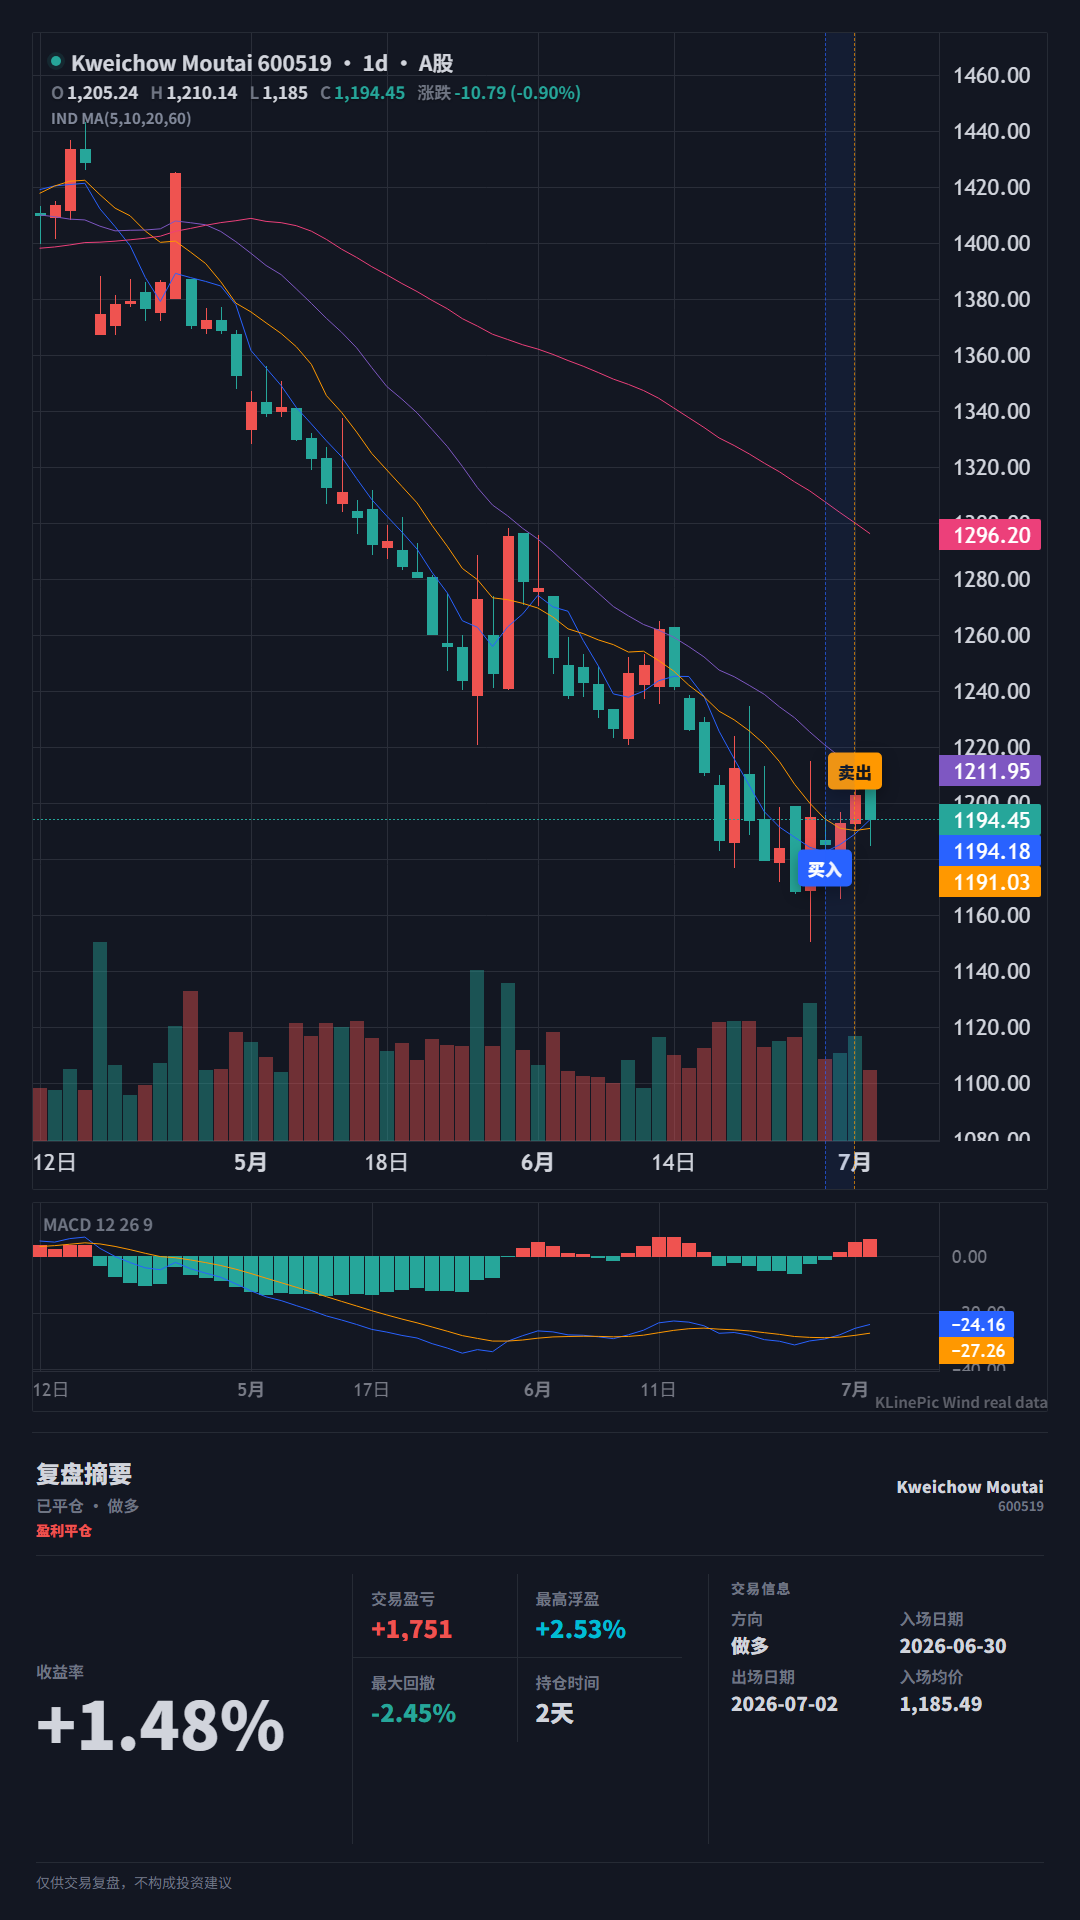
How it works
- Upload a file — a trade log, broker statement, exchange export, or backtest result (CSV / XLS / JSON).
- Auto-convert — KLinePic normalizes it into standard trade records.
- Review check — verify trade count, time range, and data source before rendering.
- Generate images — get a TradingView-style K-line review chart, single or batch.
What you get
- Buy and sell markers on your real entries and exits
- Return %, max drawdown, and holding period in a review panel
- Crypto, US stocks, China A-share, and futures — one tool
- Batch export and an Agent API for AI agents to generate charts
- Free to start, with paid plans for higher limits and watermark-free export
Paid plans and pricing
Basic chart generation remains free. Paid subscriptions add higher monthly limits and watermark-free export. Prices are in USD; taxes may be added at checkout.
Subscriptions renew until cancelled. Customers can cancel from the account billing page. View plan details.
Guides by exchange, broker, and format
Explore
Support and policies
Email support@klinepic.com. We normally reply within 3 business days.
FAQ
Is KLinePic free? Basic use is free. Pro, Studio, and Team subscriptions are available for higher limits and watermark-free export, starting at $29 per month.
Which exchanges and brokers? Binance, OKX, Bybit, Bitget, Gate, MEXC, KuCoin, HTX, plus Robinhood, Webull, E*TRADE, Fidelity, Charles Schwab, Interactive Brokers, and China A-share contract notes.
Does it work for A-shares and US stocks? Yes — A-share (contract notes / 对账单), US stocks, crypto, and futures.
What file formats? CSV, XLS, JSON — trade logs, broker statements, exchange exports, Tonghuashun exports, and backtest results.